

[비즈한국] As the government prepares to announce plans for a second wave of public institution relocations, analyses suggest that the impact of the first wave has been lackluster. Previously, the government moved the headquarters of over 100 public enterprises and institutions to provincial "Innovation Cities." Despite this, growth rates for population and businesses in these Innovation Cities have fallen short of the national average. Many employees of these public institutions still spend their weekends and holidays in the Seoul metropolitan area, while those not affiliated with these institutions find no reason to reside in Innovation Cities. This is widely attributed to a relative lack of infrastructure. This is why experts point out that tangible improvements to residential infrastructure are essential for the second round of relocations to be effective.
Report Card of the First Relocation: Population and Business Growth Fall Short of Expectations
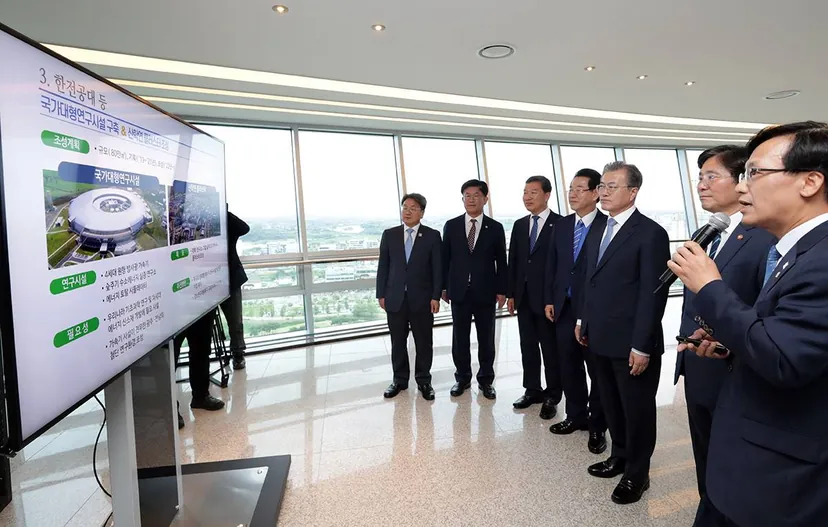
From 2003 to 2019, a total of 153 public enterprises and institutions moved from the Seoul metropolitan area to non-metropolitan regions. Of these, 112 moved to designated Innovation Cities. Innovation Cities were developed as hubs for regional growth following the relocation of public institutions and are distributed across 10 metropolitan local governments nationwide. The government had planned to turn these Innovation Cities into futuristic urban centers through these relocations.
The Gwangju-Jeonnam Innovation City, Chungbuk Innovation City, and Gangwon Innovation City are considered relatively successful cases. Naju, where the Gwangju-Jeonnam Innovation City is located, saw a significant population increase following the relocation of the Korea Electric Power Corporation (KEPCO) and its affiliates in 2014. According to the Statistics Korea population census, the population grew from the 70,000 range in 2010 to surpass 120,000 by 2025. This is largely attributed to the considerable influence of KEPCO, one of the largest public enterprises in the country.
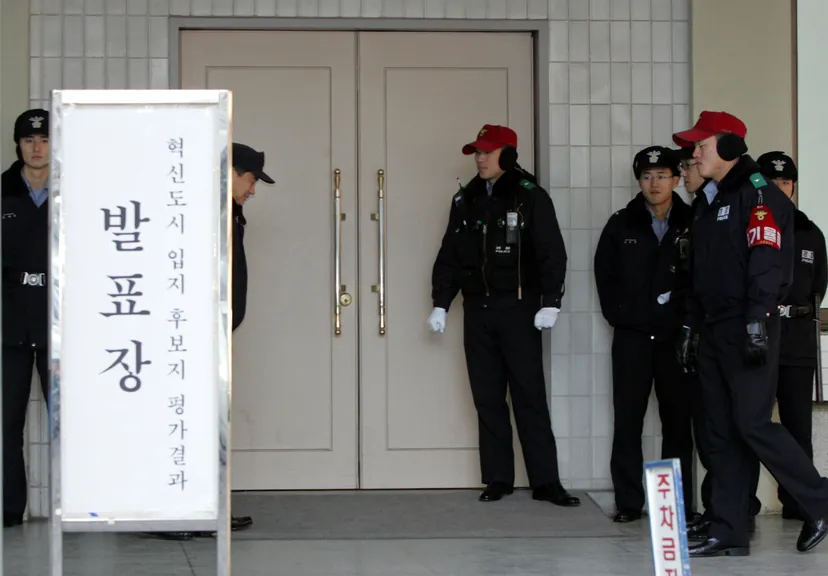
Chungbuk Innovation City is situated in Deoksan-eup, Jincheon-gun, and Maengdong-myeon, Eumseong-gun. The headquarters of the Korea Gas Safety Corporation, the Korea Employment Information Service, the Korea Consumer Agency, and the Korean Agency for Technology and Standards are located there. The population of Eumseong-gun, which was in the 80,000 range in the 2000s, has now exceeded 100,000. Jincheon-gun, which previously had a population in the 60,000 range, is also on the verge of hitting the 100,000 mark.
Wonju, home to the Gangwon Innovation City, hosts the headquarters of the Korea Mine Rehabilitation and Mineral Resources Corporation, the National Health Insurance Service, the Korea Tourism Organization, the Korean Red Cross, and the National Forensic Service. The population of Wonju showed a sharp upward trend, increasing from 268,352 in 2000 to 367,326 in 2025. Additionally, Wanju-gun, home to the Jeonbuk Innovation City, has also seen population growth. Considering the recent crisis of regional extinction, these Innovation Cities appear to be showing a degree of success.
| 2000 | 2005 | 2010 | 2015 | 2020 | 2025 | ||
|---|---|---|---|---|---|---|---|
| Busan | Yeongdo-gu | 177,899 | 158,117 | 139,723 | 129,515 | 113,224 | 104,268 |
| Nam-gu | 289,747 | 294,034 | 293,900 | 283,741 | 269,111 | 256,859 | |
| Haeundae-gu | 396,505 | 393,718 | 410,084 | 409,037 | 389,535 | 362,368 | |
| Daegu | Dong-gu | 334,752 | 334,298 | 319,754 | 339,608 | 333,294 | 332,631 |
| Gwangju/Jeonnam | Naju-si | 99,533 | 87,212 | 78,679 | 92,582 | 113,293 | 120,095 |
| Ulsan | Jung-gu | 227,455 | 226,115 | 222,493 | 236,988 | 214,147 | 200,473 |
| Gangwon | Wonju-si | 268,352 | 284,360 | 311,449 | 330,854 | 352,429 | 367,326 |
| Chungbuk | Jincheon-gun | 57,559 | 58,681 | 61,915 | 71,152 | 89,514 | 96,305 |
| Eumseong-gun | 84,433 | 82,970 | 84,088 | 102,023 | 103,725 | 109,922 | |
| Jeonbuk | Jeonju-si | 616,468 | 623,298 | 649,728 | 658,172 | 666,517 | 641,632 |
| Wanju-gun | 79,137 | 79,541 | 83,408 | 95,357 | 95,834 | 104,592 | |
| Gyeongbuk | Gimcheon-si | 147,855 | 135,923 | 127,889 | 137,540 | 139,145 | 135,795 |
| Gyeongnam | Jinju-si | 339,791 | 337,242 | 337,896 | 349,788 | 352,403 | 344,145 |
| Jeju | Seogwipo-si | 80,860 | 78,369 | 130,713 | 153,861 | 178,552 | 178,168 |
| Innovation City Total | 3,200,346 | 3,173,878 | 3,251,719 | 3,390,218 | 3,410,723 | 3,354,579 | |
| National Total | 46,136,101 | 47,278,951 | 48,580,293 | 51,069,375 | 51,829,136 | 51,817,499 |
However, other Innovation Cities have populations similar to their past levels or are actually experiencing a decline. This is because the population-boosting effect of relocating public institutions has not been significant, or because population loss has outweighed any growth. The national population increased by 10.96% from 46,136,101 in 2000 to 51,817,499 in 2025. In contrast, the population of Innovation Cities grew by only 4.60% from 3,200,346 to 3,354,579 over the same period. As the national population began to decline in the 2020s, Innovation Cities have not been immune to this trend.
The growth rate of small and medium-sized enterprises (SMEs) in Innovation Cities also falls short of the national average. Considering the reality that most headquarters for large corporations and mid-sized firms are in the capital region, SMEs act as the primary engine for local economies. A lack of SMEs can be interpreted as a lack of jobs.
| 2020 | 2021 | 2022 | 2023 | 2020-2023 Growth Rate | ||
|---|---|---|---|---|---|---|
| Busan | Yeongdo-gu | 12,399 | 12,855 | 13,342 | 13,406 | 7.51% |
| Nam-gu | 29,652 | 30,562 | Data N/A | 31,700 | 6.46% | |
| Haeundae-gu | 50,289 | 53,205 | 54,653 | 55,190 | 8.88% | |
| Daegu | Dong-gu | 41,469 | 43,604 | 45,172 | 46,085 | 10.02% |
| Gwangju/Jeonnam | Naju-si | 18,776 | 20,331 | 21,753 | 23,197 | 19.06% |
| Ulsan | Jung-gu | 24,036 | 24,634 | 25,050 | 25,342 | 5.15% |
| Gangwon | Wonju-si | 47,699 | 51,035 | 53,376 | 55,034 | 13.33% |
| Chungbuk | Jincheon-gun | 12,301 | 13,164 | 13,849 | 14,239 | 13.61% |
| Eumseong-gun | 16,995 | 18,416 | 19,613 | 20,451 | 16.90% | |
| Jeonbuk | Jeonju-si | 85,817 | 89,739 | 92,434 | 94,808 | 9.48% |
| Wanju-gun | 13,746 | 14,812 | 15,662 | 16,659 | 17.49% | |
| Gyeongbuk | Gimcheon-si | 17,068 | 18,124 | 19,032 | 19,735 | 13.51% |
| Gyeongnam | Jinju-si | 46,009 | 48,023 | 49,566 | 50,040 | 8.06% |
| Jeju | Seogwipo-si | 32,741 | 34,956 | 36,856 | 37,481 | 12.65% |
| Innovation City Total | 448,997 | 473,460 | 460,358 (Excl. Nam-gu) | 503,367 | 10.80% | |
| National | 7,286,082 | 7,713,895 | 8,042,726 | 8,298,915 | 12.20% |
According to Statistics Korea, the total number of SMEs nationwide increased by 12.20% from 7,286,082 in 2020, after the first wave of relocations was completed, to 8,298,915 in 2023. Conversely, the number of SMEs in Innovation Cities increased by 10.80% from 448,997 to 503,367 over the same period.
Regions where the SME growth rate surpassed the national average include Gwangju-Jeonnam, Gangwon, Chungbuk, Gyeongbuk, and Jeju Innovation Cities. Even then, the growth in Seogwipo-si, where the Jeju Innovation City is located, is attributed largely to an increase in leisure-related businesses following the end of the COVID-19 pandemic. In the case of the Jeonbuk Innovation City, while the number of SMEs in Wanju-gun increased significantly, the growth rate in Jeonju-si was not particularly high.
| 2020 | 2021 | 2022 | 2023 | 2020-2023 Growth Rate | ||
|---|---|---|---|---|---|---|
| Busan | Yeongdo-gu | 31,412 | 32,342 | 32,347 | 32,844 | 4.36% |
| Nam-gu | 62,701 | 64,326 | Data N/A | 66,044 | 5.06% | |
| Haeundae-gu | 113,520 | 119,778 | 124,064 | 123,698 | 8.23% | |
| Daegu | Dong-gu | 93,280 | 98,309 | 97,654 | 97,875 | 4.69% |
| Gwangju/Jeonnam | Naju-si | 42,971 | 45,845 | 47,778 | 49,259 | 12.77% |
| Ulsan | Jung-gu | 44,054 | 43,886 | 45,077 | 45,000 | 2.10% |
| Gangwon | Wonju-si | 105,669 | 111,284 | 114,260 | 116,231 | 9.09% |
| Chungbuk | Jincheon-gun | 41,888 | 43,333 | 45,507 | 44,907 | 6.72% |
| Eumseong-gun | 63,890 | 66,340 | 68,721 | 71,570 | 10.73% | |
| Jeonbuk | Jeonju-si | 189,410 | 196,103 | 196,876 | 196,600 | 3.66% |
| Wanju-gun | 35,071 | 36,298 | 37,016 | 38,461 | 8.81% | |
| Gyeongbuk | Gimcheon-si | 38,702 | 40,431 | 40,986 | 42,004 | 7.86% |
| Gyeongnam | Jinju-si | 100,449 | 103,099 | 104,294 | 105,984 | 5.22% |
| Jeju | Seogwipo-si | 59,737 | 63,771 | 66,538 | 66,327 | 9.94% |
| Innovation City Total | 1,022,754 | 1,065,145 | 1,021,118 (Excl. Nam-gu) | 1,096,804 | 6.75% | |
| National | 17,791,969 | 18,492,614 | 18,956,294 | 19,117,649 | 6.93% |
The growth rate of employees at SMEs in Innovation Cities is also lower than the national average. The number of SME employees nationwide increased by 6.93% from 17,791,969 in 2020 to 19,117,649 in 2023, whereas the number of SME employees in Innovation Cities increased by 6.75% from 1,022,754 to 1,096,804 during the same period. Areas like Haeundae-gu, Jung-gu, Jincheon-gun, Jeonju-si, and Seogwipo-si even saw decreases in 2023.
‘Residential Infrastructure’ is Key to Success for the Second Relocation
According to the report, "Performance and Implications of the 1st Phase of Public Institution Relocations," published by the National Assembly Budget Office, the relocation rate of employees with families (including single individuals) was 71% as of 2025. This falls short of the 75% target. While the goal was to register 267,869 new residents in non-metropolitan areas, the actual number of new registrants was 234,684.
The government initially expected the relocation of public institutions to lead to regional development in Innovation Cities. The purpose stated in the Special Act on the Construction and Development of Innovation Cities reads: “The purpose is to contribute to balanced regional development and the strengthening of national competitiveness by promoting the relocation of public institutions by stipulating matters necessary for fostering and developing Innovation Cities as hubs for regional development.”
However, for anyone other than public institution employees, there are few reasons to move one’s residence to an Innovation City. Large corporations with good welfare are concentrated in the capital region, and there are not many SMEs in the provinces. Factories affiliated with large conglomerates are also clustered in specific cities such as Pohang, Geoje, Yeosu, and Changwon, most of which are far from Innovation Cities.