

[비즈한국] If you look for exchange-traded funds (ETFs) to invest in U.S. small-cap stocks, you will find yourself deliberating between products that look similar. Representative examples are IWM and IJR. Both diversify into U.S. small-cap stocks, but their criteria for selecting companies differ. IWM includes a broad range of companies, even those operating at a loss, while IJR evaluates the profitability of companies before adding them to its index. Even among small-cap ETFs, performance and risk can vary significantly depending on which companies they hold.
This year’s market trends illustrate both the opportunities and the burdens of small-cap investing. The first-half return for IWM, which tracks the Russell 2000, was 22.48%, significantly outperforming the 10.19% return of IVV, which tracks the S&P 500. However, as of September 24, the year-to-date returns had narrowed to 15.13% and 13.48%, respectively. These figures are total returns based on net asset value in dollar terms, reflecting the reinvestment of dividends. The actual returns for domestic investors may vary depending on exchange rates and timing of trades.
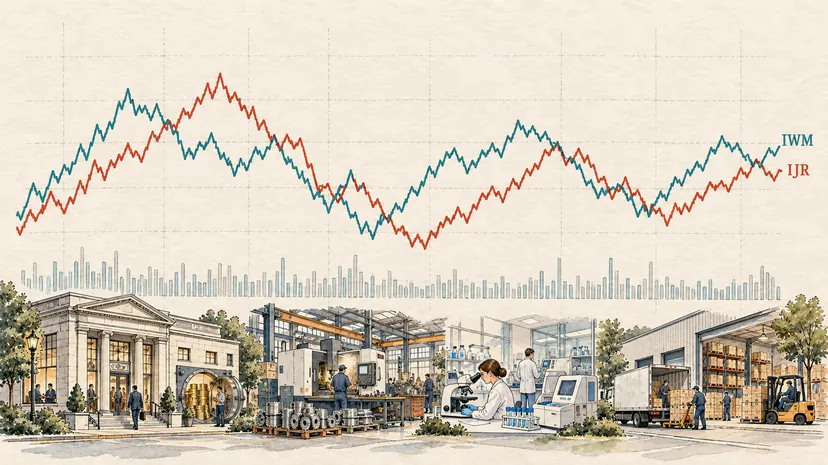
Rising interest rates are one of the burdens weighing on small-cap stocks. The U.S. 10-year Treasury yield exceeded 5% during trading on September 14, and the Federal Reserve raised its benchmark interest rate by 0.25 percentage points on the 16th. According to a Goldman Sachs analysis reported by Business Insider on July 2, approximately 30% of the debt held by Russell 2000 companies consists of floating-rate debt, where interest payments fluctuate with interest rates. For S&P 500 companies, this figure is 7%. This structure makes small-cap companies more susceptible to the burden of rising interest rates.
If you are considering small-cap investments in such an environment, you need to look beyond recent returns and examine the criteria the ETF uses to include companies.
The Russell 2000, which IWM tracks, consists of approximately 2,000 companies with small market capitalizations from the Russell 3000 index. There is no requirement for companies to be profitable, so companies that have yet to turn a profit are included. While this allows for investment in a diverse range of small-cap stocks, it also carries the risks associated with companies whose growth expectations have not yet translated into actual performance.
The S&P SmallCap 600, which IJR tracks, considers not only company size and trading volume but also profitability. In principle, new companies added from the outside must have positive net income from continuing operations for both the most recent quarter and the sum of the last four quarters. This verifies that they are actually generating profit in the course of their primary business. Meeting these conditions does not guarantee inclusion; final selection is decided by the index committee.
However, this does not mean IJR holds only profitable companies. If a company turns to a loss after being included, it is not immediately removed. There are also exceptions to the profit requirements, such as for companies moving from other S&P indices. IJR is a product with a process for screening profitability, but it is not a product that filters out all insolvency risks.
This difference can become apparent when market sentiment shifts. If interest rates fall without a significant economic downturn, the stock prices of loss-making or highly leveraged companies may rebound on expectations of reduced interest burdens. If IWM already holds such companies, it could benefit from this rebound. Conversely, if earnings recovery is delayed or financing becomes blocked, the burden of losses can increase. IWM does not pre-emptively hold every potential candidate for a turnaround, and one cannot conclude that IWM will always outperform IJR simply because interest rates are cut.
There is reason to pay attention to IJR’s profitability standards when interest rates remain high. However, the fact that a company is profitable does not guarantee its ability to repay debt. Even a company that makes a profit may need to refinance at higher rates if it has significant upcoming debt maturities and low cash holdings. This is why IJR’s inclusion criteria should not be viewed as a fail-safe against interest rate risks.
IJR has lower costs. The annual expense ratios disclosed by the fund managers are 0.19% for IWM and 0.06% for IJR. Assuming an investment of 100 million won is held for a full year, the difference is 130,000 won (190,000 won vs. 60,000 won). Trading commissions and currency exchange fees are separate. While cost differences accumulate with long-term holdings, the two products hold different companies, so you cannot compare final returns based on costs alone.
IWM has higher trading volume. As of September 25, the 30-day average trading volume for IWM was approximately 22.4 million shares, while IJR was about 3.07 million shares. If you trade frequently or handle large amounts, you should look at the bid-ask spread along with trading volume.
You should also be cautious when reading the price-to-earnings ratio (PER) displayed on the product screen. PER is an indicator that shows how high a stock price is relative to its earnings. However, iShares excludes loss-making companies when calculating the PER for both ETFs. Therefore, it is difficult to interpret a low PER on the screen as meaning that all companies in the portfolio are inexpensive, as the figures do not reflect the losses of companies in the red.
The relationship with products you already own is also important. VTI, which invests in the entire U.S. stock market, includes small-cap stocks in addition to large-cap stocks. Adding IWM or IJR to VTI essentially increases your exposure to small-cap stocks you are already holding. While this can reduce your concentration in large tech stocks, you also take on more of the economic and interest rate risks unique to small-cap stocks.
If you look beyond ETFs to pick individual small-cap stocks, the things to check are more specific. You should look not only at book profit but also at how much cash is generated from operating activities, how much debt is due over the next two years, and how much the number of shares has increased due to capital increases. Even if a company generates a profit, it may run out of cash if it cannot collect receivables or if money is tied up in inventory. Even if net income increases, if the number of shares increases at the same rate, earnings per share remain stagnant.
The same applies to the maturity and interest rate of debt. If you refinance the same amount of debt from a 3% to a 7% annual interest rate, your annual interest burden increases by 4% of the principal. Even if a company looks like it has growth potential, if it lacks the cash to survive until then, it may have to ask shareholders for more capital.
The starting point for choosing a small-cap ETF is not "which product will go up more," but deciding "what kind of companies do I want to invest in." If you want to lean toward broad small-cap exposure, you can examine the composition of IWM; if you prioritize profitability standards and low costs, you can look at the composition of IJR. Either way, rather than relying on interest rate forecasts alone, you should first decide how much you want to increase the small-cap portion of your total portfolio.