

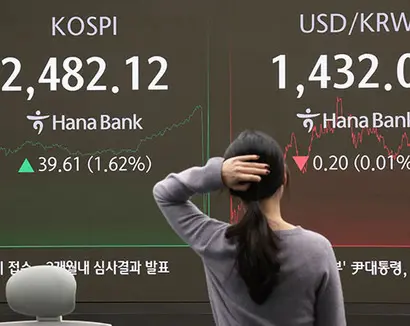
[비즈한국] The South Korean stock market has recorded its worst monthly performance among the Group of 20 (G20) nations this year. The KOSPI index rose in only three months of the year (January to November), and the KOSDAQ index followed the same trend, posting gains in only three months while declining in all others. While U.S. stock indices have been hitting record highs daily due to expectations of deregulation following former President Donald Trump's election victory, and other countries have fared relatively well despite not matching the U.S. surge, South Korea stands alone in its downward trend.
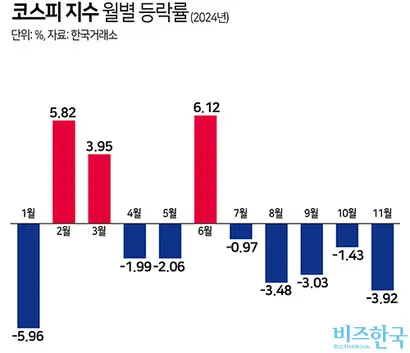
According to the Korea Exchange and other sources, from the beginning of this year through November, both the KOSPI and KOSDAQ indices recorded gains in three months and declines in eight. For the KOSPI, the closing price was higher than the opening price only in February (5.82%), March (3.95%), and June (6.12%). Notably, the index suffered a five-month streak of closing lower than its opening from July (-0.97%) through November (-3.92%). The KOSDAQ index mirrored this trend, recording negative growth on a monthly basis for every month except February (7.97%), March (4.93%), and June (0.05%).
The problem is that the outlook for December is also bleak. Political uncertainty has surged following President Yoon Suk-yeol's declaration of emergency martial law on the 3rd and the subsequent impeachment turmoil, causing the stock market to fluctuate violently. Although domestic institutional investors have been buying up shares sold by foreigners to cushion the fall, the market is highly likely to record another decline in December if the impeachment situation persists. This year's monthly performance for the KOSPI and KOSDAQ is the worst in 24 years. During the collapse of the IT bubble in 2000, the KOSPI index fell in 9 out of 12 months, and the KOSDAQ index fell in 10 months.
In contrast, the U.S. has shown a clear monthly upward trend this year. The Dow Jones Industrial Average recorded a negative monthly change in only 3 out of 12 months (December based on the closing price on the 12th) and remained in the plus for 9 months. Although the Dow fell by 5.00% in April, it rose for five consecutive months from May (2.30%) to September (1.85%). In October, it fell 1.34% due to political uncertainty surrounding the presidential election, but it surged 7.54% in November after President-elect Donald Trump’s victory was confirmed. While the stock market has entered a correction phase in December after its rapid ascent, the decline is expected to be minimal. The NASDAQ also recorded gains in 9 out of 12 months. Specifically, after a 6.21% rise in November, the month of the election, it is currently recording a gain of over 4% in December, having surpassed the 20,000 mark for the first time in history.
Even China and Japan, where concerns over economic stagnation have grown, are in better shape than South Korea. China's Shanghai Composite Index recorded 6 months of gains and 6 months of declines this year. Although it fell for four consecutive months from May (-0.58%) to August (-3.28%), it has gradually recovered, recording back-to-back gains in November (1.42%) and December (3.80%). Japan's Nikkei index rose in 7 months (January, February, March, May, June, October, and December) and fell in 5 months, showing more months of growth than decline.
European markets also saw more months of gains this year. The Euro Stoxx 50 index rose in 7 months (January, February, March, May, August, September, and December) and fell in 5 months. The UK's FTSE index also recorded 7 months of gains (March, April, May, July, August, November, and December). France's CAC index rose in 8 months (January, February, March, May, July, August, September, and December), while Germany's DAX index also rose in 8 months (January, February, March, May, July, August, September, and November). Italy’s FTSE MIB index also recorded gains in 8 months (January, February, March, May, July, August, October, and December) this year.
Other G20 countries also experienced more months of growth. Canada’s S&P/TSX index rose for 9 months, excluding April, June, and December, and India’s S&P BSE SENSEX index also recorded 9 months of gains, excluding January, May, and October. Australia’s S&P/ASX index saw gains in 8 months (January, February, March, May, June, July, September, and November), as did South Africa’s FTSE/JSE index (March, April, May, June, July, August, September, and December). Turkey’s BIST index rose in 7 months (January, February, April, May, June, November, and December). Saudi Arabia’s Tadawul index and Indonesia’s IDX index both managed gains in 6 months (February, June, July, August, October/September, and December), essentially splitting the year.
Even Russia, which has been at war with Ukraine for over two years, and Argentina, which has been experiencing economic turmoil following a change in government, fared better than South Korea. Russia’s MOEX Russia Index (RTSI) showed a downward trend overall, but recorded monthly gains in 7 months (January, February, March, April, June, September, and December). Argentina’s S&P Merval index also recorded 7 months of gains (January, March, April, May, August, October, and November).
Aside from South Korea, the only G20 countries where the market rose in fewer than half of the 12 months were Brazil and Mexico. Brazil’s Bovespa index rose in only 5 months (February, June, July, August, and December), while Mexico’s S&P/BMV IPC index recorded gains in only 4 months (March, July, September, and December).